Documentation
cFos Charging Manager usage graphs
Dashboard
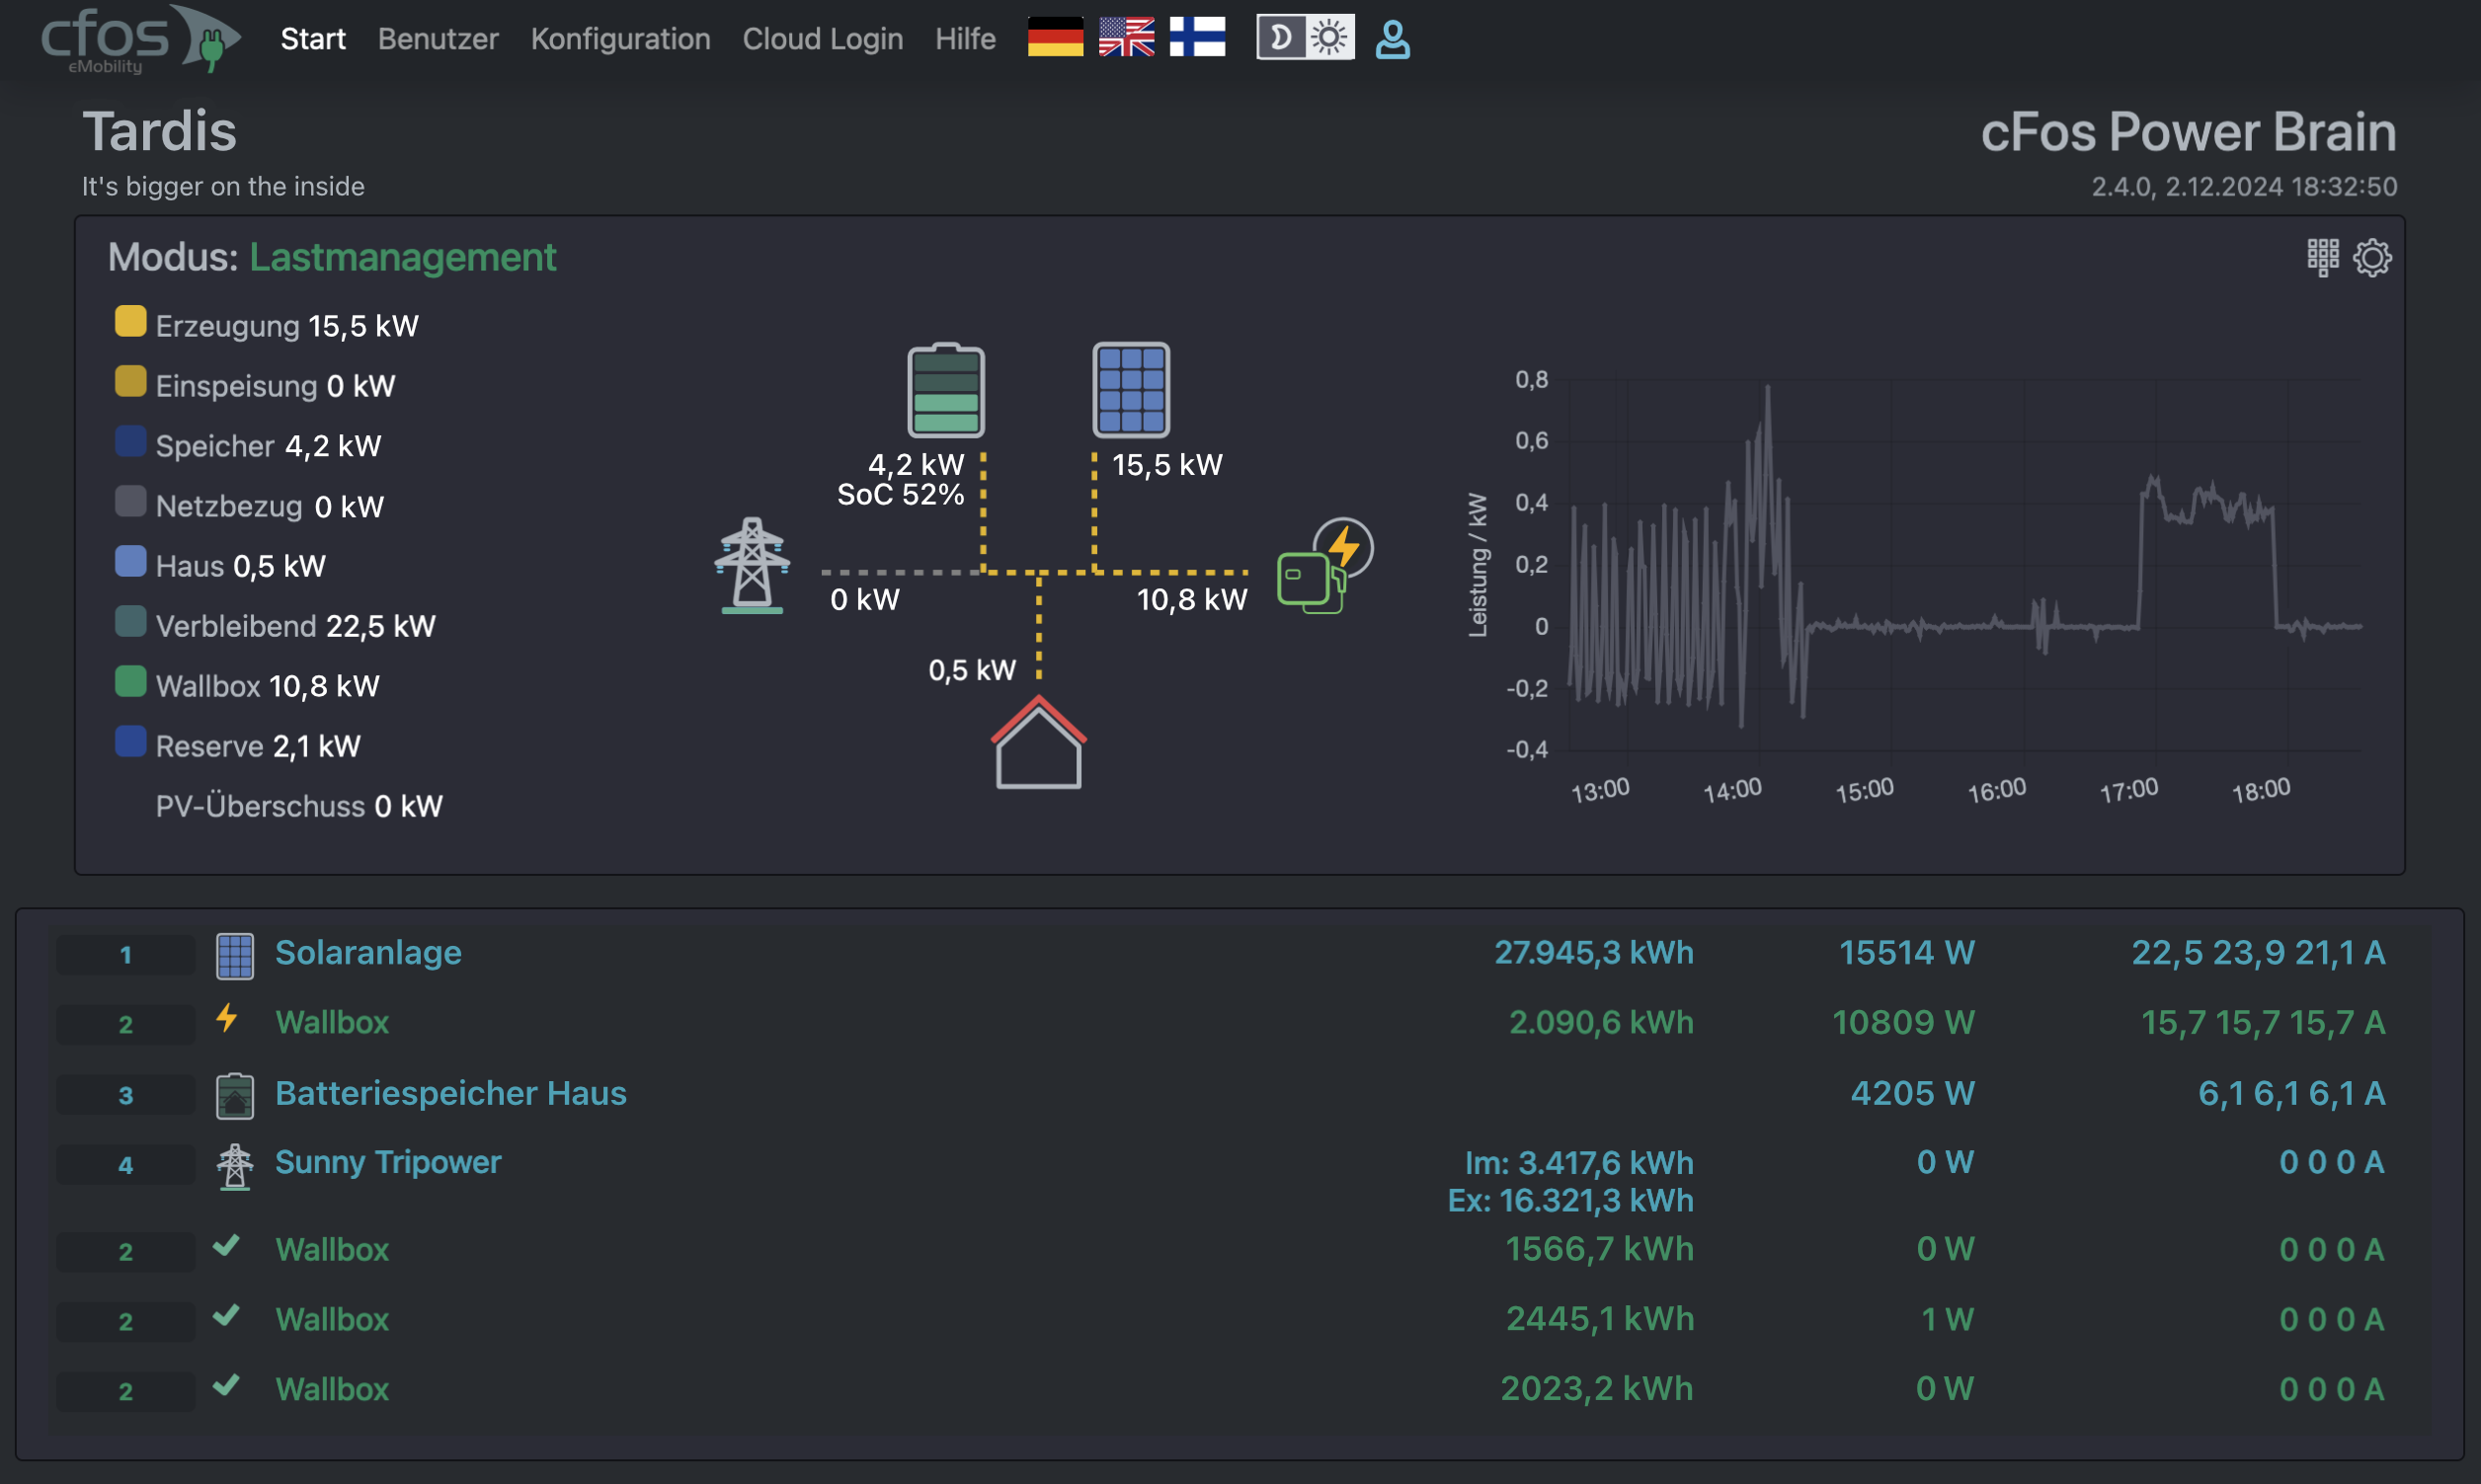
The flow chart in the dashboard shows the consumers of the available power, i.e. house (i.e. consumers other than electric cars), EVSE (electric cars) and battery storage (if it is currently charging), and the producers, i.e. grid supply, solar system and storage (if it is discharging). If possible, the current status of consumers and producers is also indicated by the symbols.
The cFos Charging Manager takes into account the roles of the meters for load management and for the display, as follows:
| Role | Display / Load management |
|---|---|
| Grid consumption | Power at the transfer point, positive for consumption, negative for feed-in |
| Consumption | Home consumption and other consumers, without wallboxes Load management: If there is no grid reference meter, the Charging Manager calculates the power at the transfer point from consumption minus feed-in plus wallbox consumption. If a grid supply meter is available but no consumption meter, the Charging Manager calculates the consumption from the grid supply, generation and wallbox consumption. |
| Generation | Generation, e.g. by PV system |
| Storage | Applies as a generator (outer ring) when discharging and as a consumer (inner ring) when charging. The storage system is ignored as a consumer in load management, as it stops charging as soon as grid consumption occurs. In the event of PV surplus charging (solar surplus charging), a discharging storage system with the role "Storage Home" is ignored, while a storage system with the role "Storage All" is regarded as a generator. |
| Consumption of electric cars and wallboxes | Current charging power of the wallboxes |
The Charging Manager can display an overview below the flow chart. In the settings of the individual devices, you can configure whether the respective device should be displayed in the overview. This allows you to see important devices at a glance. The diagram in the overview allows you to plot the performance of different devices on top of each other and thus see them in relation to each other. For example, you can display the charging power in conjunction with the generator power in order to optimise your consumption or check to what extent the charging of electric cars coincides with the use of large energy consumers.
Usage graphs of the devices
In order for the cFos Charging Manager to display graphs, you must activate the recording of measurement data in the device settings. The latest measurement data is recorded approximately every 10sec. To save memory (and to conserve flash memory), the cFos Charging Manager compresses older data, i.e. it combines several measured values. The further back in time you go, the coarser the resolution. Nevertheless, you can still display a suitable monthly and annual overview. In the device settings, you can now determine whether the device should be displayed in the dashboard overview and whether the tile should contain a usage graph.
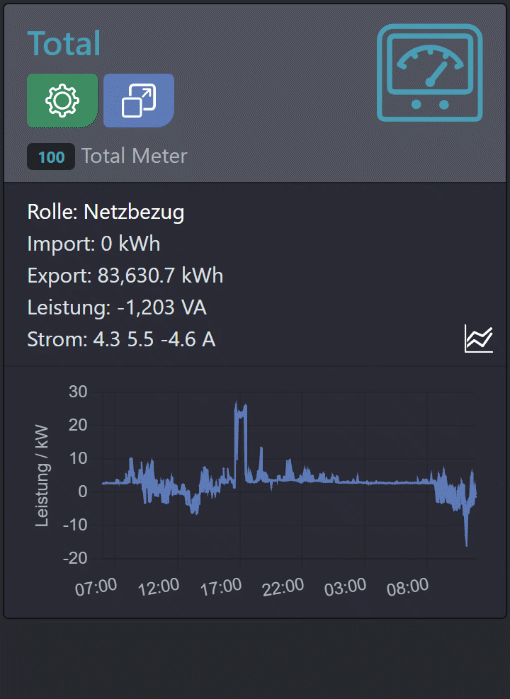
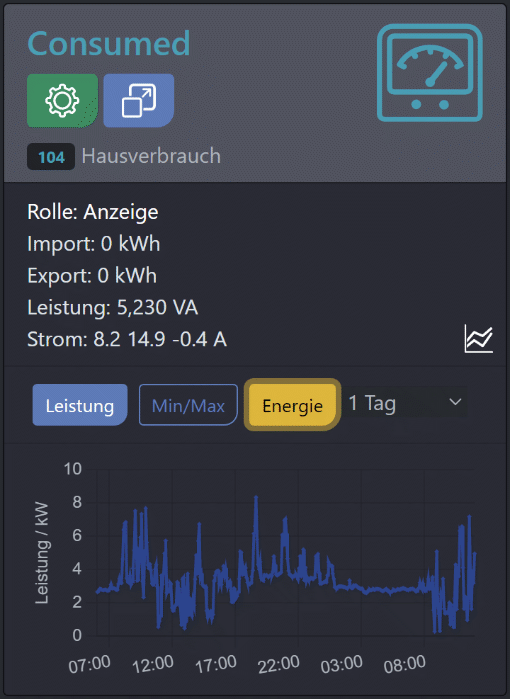
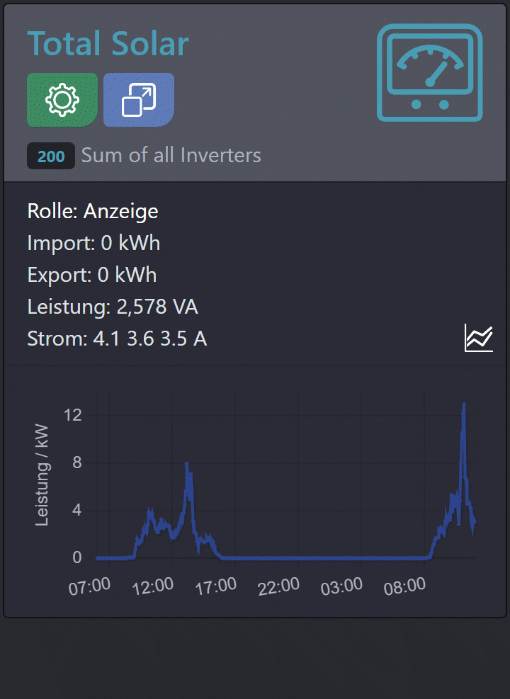
If you click on the "Graph" icon in the tile, you can set the time range of the graph and select which data should be displayed. "Power" is the mean value of the recorded measured values, "Min/Max" the minimum/maximum of the recorded values in the resolution interval, "Energy" the kWh in the time range. You can also zoom into the time range using the mouse or touch.
Examples of usage graphs
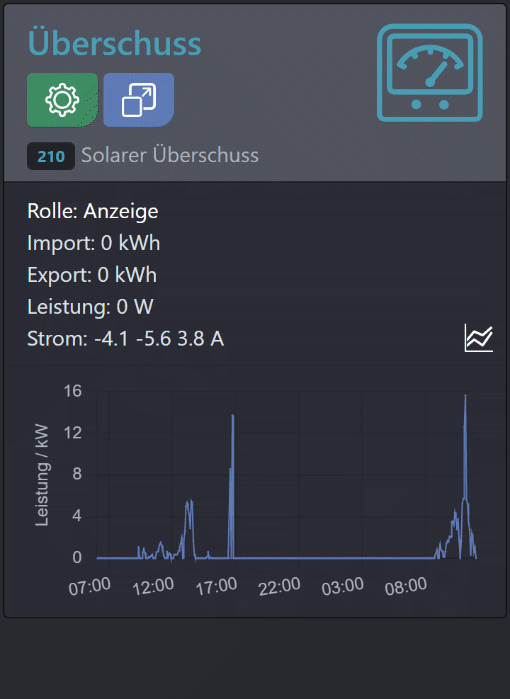
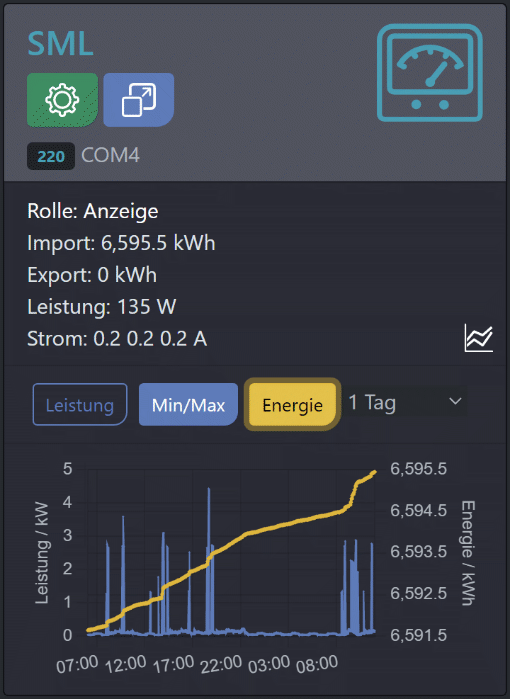
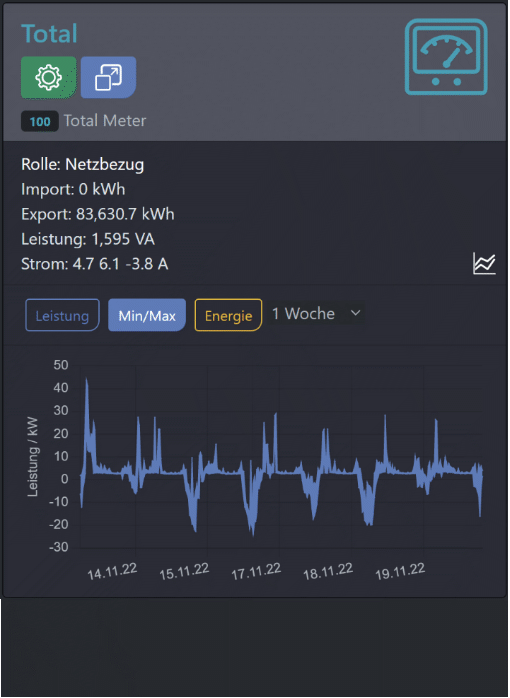
Possible applications of the usage graphs
In addition to the graphic display of when which car was charged and with how much energy, the graphics of certain meters give you valuable information:
- Mains supply: Here you can see over time how heavily your mains connection is loaded and, if applicable, your feed-in of solar power. Note: Even without wallboxes, you can use the cFos Charging Manager to find out whether the ordered connection power is sufficient to charge electric cars during periods of low use. To do this, you must have a suitable meter installed at the house connection.
- With the virtual counters"Power available for EVSEs" or "Power remaining for EVSEs" and"Consumed EVSE Power", you can estimate over longer periods of time when there are bottlenecks in the charging power or when the cFos Charging Manager had to reduce the charging power.
- With the virtual meter"Consumed Non-EVSE Power" you represent the power demand of other consumers in the house (e.g. flats, ventilation systems, etc.), which are subtracted from the available charging power.
- The virtual counter"Produced Power" provides you with an overview of your (solar) generation output.
- The virtual counter"Surplus" provides you with an overview of the solar surplus that is or could be available for charging. It is a good idea to place this in the overview of the graph of the consumption of electric cars "Consumed EVSE Power" to see how well your cars are using the solar surplus.
- Flat meters: With modern measuring devices, you can easily read them with an optical reading head. Then the cFos Charging Manager allows you to evaluate the flat consumption in detail and optimise the consumption as a result. For example, in graphs that do not go back too far in time, you can see electricity consumers such as refrigerators, cookers, kettles, hair dryers, etc. very clearly. In addition, this graph gives you a good overview of your base load.
Note: The Windows and Raspberry version of the cFos Charging Manager can be used for an unlimited period of time as long as you do not operate any "third-party" wallboxes. This means that this graphical evaluation is also available to you for an unlimited period of time. This is also integrated in the cFos Power Brain wallboxes. - With the virtual counter"Error EVSE comsumption" you can detect connection errors in your system. If the wallbox has a failsafe mechanism, the cFos Charging Manager sets it to 3 minutes and 6A charging power. The wallbox then goes into failsafe mode for more than 3 minutes in the event of a communication failure and only charges with 6A (as little as possible, but so that there is a chance that the car will be charged the next morning). The cFos Power Brain wallboxes and many wallboxes supported by the cFos Charging Manager can handle the failsafe mode. Conversely, if the cFos Charging Manager receives no response from a wallbox for 3 minutes, it assumes that the wallbox is in failsafe mode or assumes that the car is charging at full power. This power is then considered as a separate consumer called"Error EVSE consumption" and deducted from the charging power of the other wallboxes. This prevents the fuse from being triggered by a communication failure. With the "Error EVSE consumption" counter, you can monitor such errors over longer periods of time.
